
Essential Soil Test
The standard university panel: OM, nitrate, P, K, secondaries, micronutrients, pH, CEC and salts. A good fit for grid sampling, manure management and composite samples.
Laboratory · Alpena, SD
We test what impacts the farm: soil, plant tissue, water and grain. Accurate, consistent results are the baseline. What sets our lab apart is knowing what the levels and ratios need to be, and turning them into a recommendation that pays.
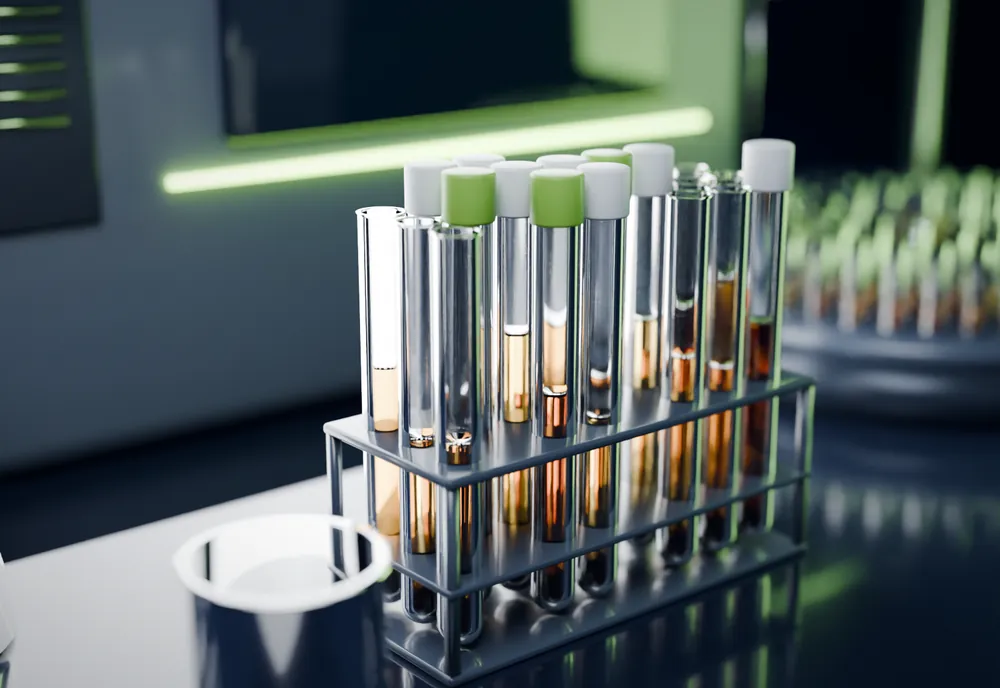
What we test
Soil, plant tissue, water and grain, all run here in our Alpena lab.
From the Essential Soil Test to Indicator Complete and Indicator Max, plus grid packages and individual tests.
ALP proficiency testedPlant Complete tissue analysis, stalk nitrate and forage nitrate, read against the soil from the same spots.
ALP proficiency testedWater testing for the farm. Call the lab and we’ll set you up with the right test.
Call for detailsGrain analysis run in the same lab. Call for details on what fits your question.
Call for detailsALP proficiency testing covers our soil and plant tissue work.
Soil report guide → What each number on your NLAg soil report measures and why it matters.
How we read a sample
Accurate numbers are the start. A level can look fine on its own and still be out of balance with the nutrients around it. Knowing what the levels and ratios need to be for your soil and crop is what turns a test into a recommendation that pays.
Numbers
Every nutrient measured right: P, K, Ca, Mg, S, Zn and the micros, plus pH, organic matter and CEC.
Ratios
Nutrients compete with each other. We read Ca, Mg and K as a share of CEC, check K:Mg and P:Zn, and in season, tissue ratios like N:S.
Recommendation
Each reading points to a decision: add what’s short, hold what’s balanced, skip what won’t pay back. Built from our own regional trials and your yield goals.
Relationships we read
Sets how much Ca, Mg and K the soil can hold, and what “balanced” means for this field.
Base saturation share of CEC
Nutrient ratios
What the report says to do
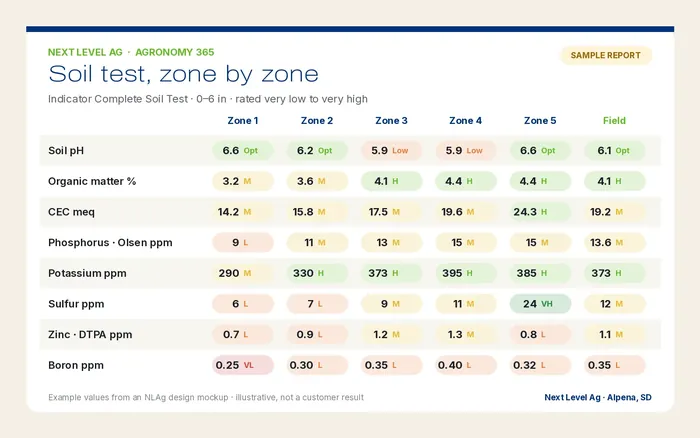
Example values for illustration, not a real sample. Targets depend on your soil, CEC and crop.
Accuracy first
Every recommendation we make stands on the lab result under it. That’s why accuracy and consistency come first in our Alpena lab, sample after sample and year after year.
Next Level Ag participates in the Agricultural Laboratory Proficiency (ALP) Program, run by Collaborative Testing Services. ALP covers both our soil and plant tissue testing. Three times a year, ALP sends the same prepared samples to the labs in the program. Each lab runs them with its routine methods and reports its results. ALP then compares every lab’s numbers and sends each lab a report on how its results lined up.
For you, that means our results get checked against other labs on a regular schedule, not just by our own team. It’s one more way we hold ourselves to accurate, consistent numbers before we build a fertility plan on them.
About the ALP Program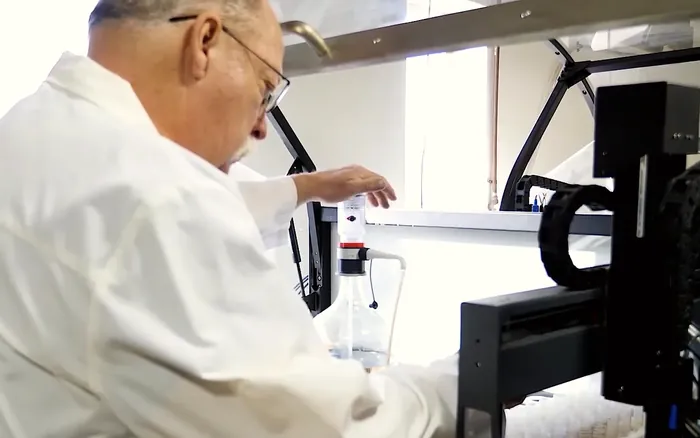
Soil test packages
Not every field needs the same answer. Start with what the decision calls for.
The standard university panel: OM, nitrate, P, K, secondaries, micronutrients, pH, CEC and salts. A good fit for grid sampling, manure management and composite samples.
It includes the Essential panel, then adds plant-available nutrients, biological activity, organic carbon and nitrogen, and aggregate stability. Results come with nutrient relationships and a Soil Health Score, and they’re built for zone management.
Everything in Indicator Complete, plus total nutrient analysis. You see the total pool of each nutrient in the soil, not just what’s available today.
Grid packages, Plant Available Test, Carbon–Nitrogen and individual tests are available for specific questions. Package details and prices are on the Pricing page.
Compare Packages and Prices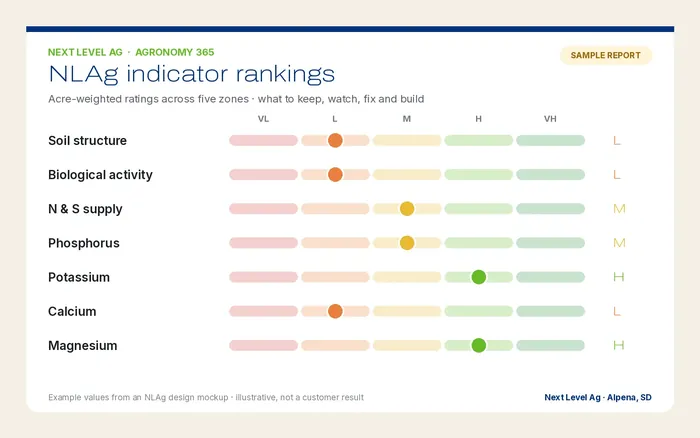
Plant tissue
We pull tissue and soil from the same spots at different crop stages. Comparing them, levels and ratios like N:S, shows whether the crop is getting what the soil has to offer, or whether something is holding it back.
Tests offered
More than soil
Reports
Our Indicator Complete report ranks each primary nutrient. Each nutrient’s scores roll up into an Overall Efficiency Rating, and that rating is paired with your yield goal to build the recommendation. You can see where to focus without digging through a page of ppm.
Turnaround and sample handling
Samples are received, logged and analyzed by our own team at 617 Pine Ave N. Results typically come back 2 to 4 days after samples arrive at the lab. Timing varies by season.