
Zones
We split the field where the soil actually changes. Soil imagery, topography and water movement are layered and weighted to fit each field.
Mapping Center
Good lab data starts with sampling the soil that’s actually there. Our zone maps and prescriptions tie every result back to the ground it came from.
Baseline Rx
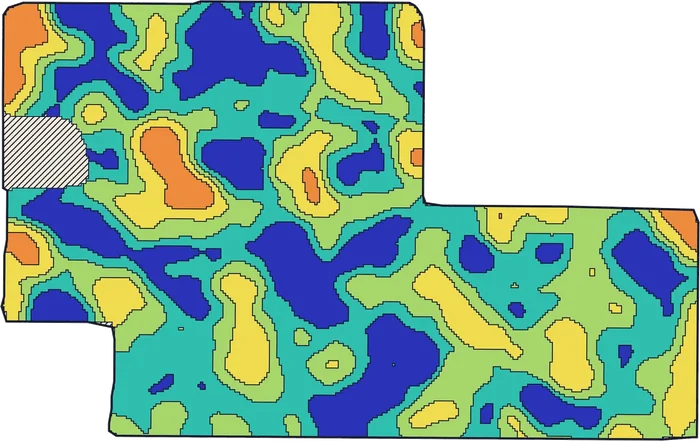
Baseline Rx brings together the three pieces of a fertility plan that fits the field.
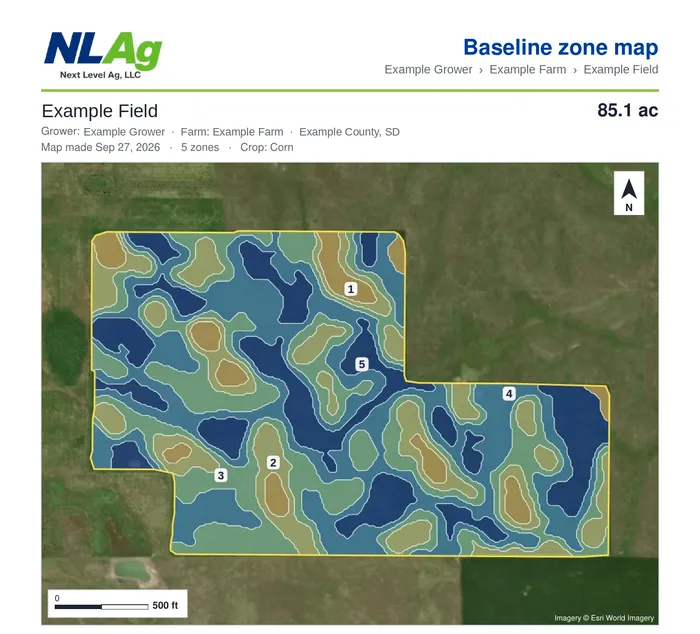
We split the field where the soil actually changes. Soil imagery, topography and water movement are layered and weighted to fit each field.
Soil samples are pulled inside those zones, so each result describes a soil that really exists in the field, not an average of several.
Lab results, zones and your yield goals come together in a fertility recommendation for each zone.
Take the whole program, or just the piece you need. Each part is available on its own.
Ask About Baseline RxThe layers
Bare-soil satellite imagery from several years, showing color, organic matter and texture differences.
Elevation data showing hills, slopes and low spots, and which areas dry out first or hold water.
Where water moves and collects. That drives nutrient movement, salinity, organic matter and erosion.
Adaptive Grid
Adaptive Grid combines map layers with lab results to show more clearly where each zone begins and ends. That matters most for applications like lime and manure.
Prescriptions
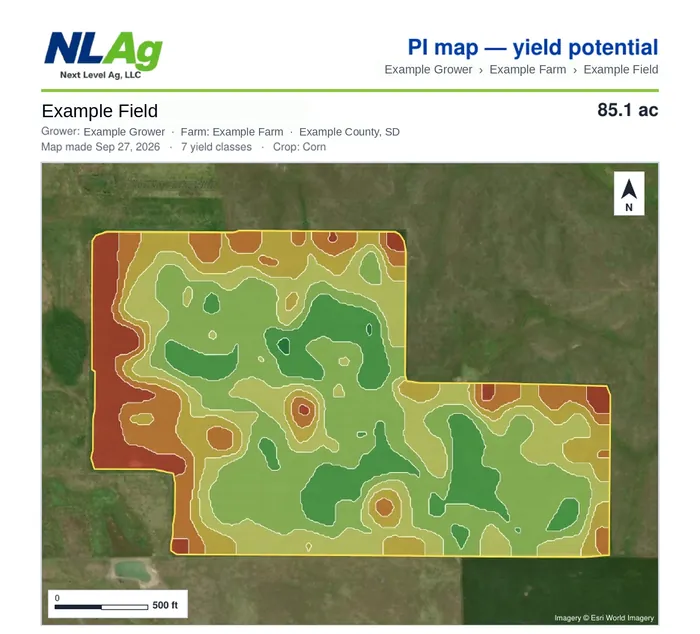
Prescriptions start with the field’s makeup: the zone map, soil and tissue results from Indicator Complete, and yield potential. From that we build variable-rate fertilizer and seeding scripts for each zone, aimed at putting dollars where they return the most.
Learning Blocks
We build Learning Blocks into your prescriptions. These are control areas at low, average and high rates. At the end of the year we compare them with your yield map. That shows what the prescription earned and what to adjust next year.
Getting started
Send shapefiles (preferred), FSA maps or legal descriptions.
We build the zone map from the soil, topography and water layers.
We send the map back for your review and changes, then set sample points.
Zones are sampled. We can send the points to whoever samples, or walk you through sampling it yourself.
Fill out our fertilizer information sheet (crops, yield goals, fertilizer type and placement). We build the plan from there.
Tell us the machine and monitor, and we’ll send scripts to you or straight to the monitor.
Start with a field boundary
Send a shapefile, FSA map or legal description. For maps and field boundaries, contact Collin at collinb@nextlevelag.com, or call the lab at (605) 849-5227.